
The key to maintain reliable Smart Home is to have a good monitoring setup. One of the most popular monitoring solution is the combination of InfluxDB and Grafana.
Table of Contents
Home Assistant Node Red InfluxDB and Grafana integration
I will show you how to use InfluxDB to store data from Home Assistant and Node-RED and then how to use Grafana to visualise the data in beautiful dashboards.
Learning, installing, and configuring InfluxDB and Grafana requires time, multiple steps, and understanding how they fit together. Fortunately you found this video tutorial and I will show you everything in a very easy, fast and understandable way.
At the end if you follow my steps you will have seamlessly working Monitoring of your Smart Home data coming from Home Assistant and Node-RED, so let’s go:
Needed Hardware
I’m using one Raspberry Pi 4 for the Home Assistant Node Red InfluxDB and Grafana integration. I also tested this on Raspberry Pi 3 and it worked fine.
So don’t be afraid that it will be too heavy for your system if you have something suitable in your home.
If not, here are some examples that you can buy:
- Raspberry Pi 4 4GB Starter Kit – https://amzn.to/2S1IZrv
- Raspberry Pi 4 Model B 2019 Quad Core 64 Bit WiFi Bluetooth (4GB) – https://amzn.to/2qs0Dtw
- Raspberry Pi 3 Kit – https://amzn.to/2TFyeMp
What is InfluxDB
You may wonder what exactly is InfluxDB – in simple words it is a time series database that can handle high write and query loads.
InfluxDB is written for time-stamped data, and it is especially helpful for DevOps monitoring, IoT monitoring, and real-time analytics.
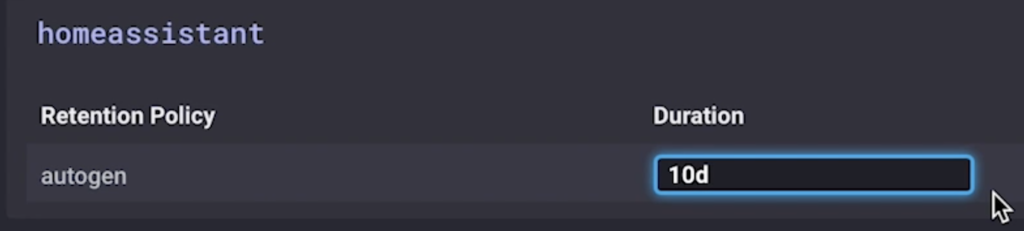
You can configure InfluxDB to keep the data for a predefined period of time, and to automatically delete the unwanted data from the system to save your disk space.
InfluxDB Installation
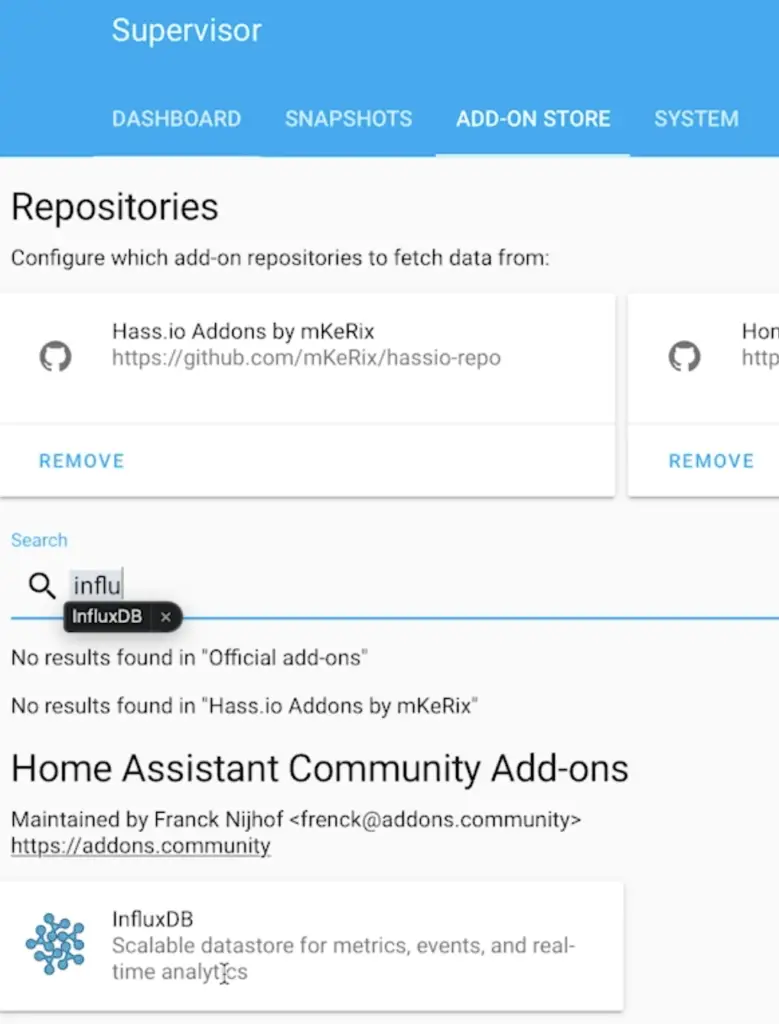
Go to your Home Assistant -> Supervisor -> ADD-ON STORE and search for influxDB.
This is the official documentation of the InfluxDB add-on if you need more info – link.
Still don’t have Home Assistant?
Follow this video tutorial and then come back here – LINK
The InfluxDB is installed and you already know what exactly is influxDB, now lets create a Home Assistant and Node-RED databases.
Create Home Assistant and Node-RED databases
Choose “InfluxDB Admin” menu from the influxDB web user interface named Chronograf. Then click on the “Create Database” button and type a database name.
You have to repeat the same procedure twice. Once for Home Assistant and once for Node-RED.
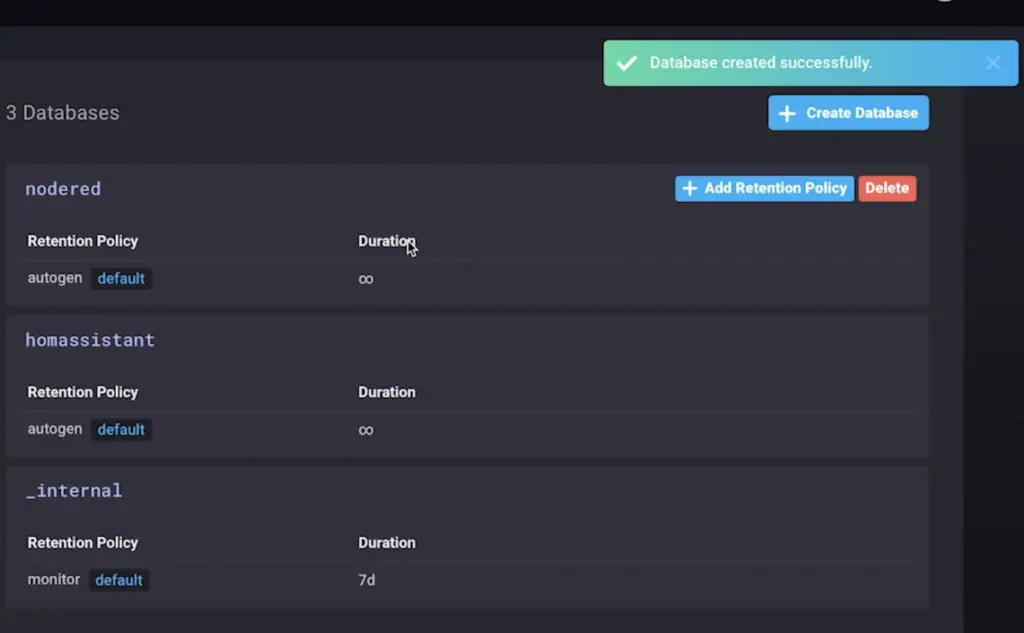
At the end you should have something similar.
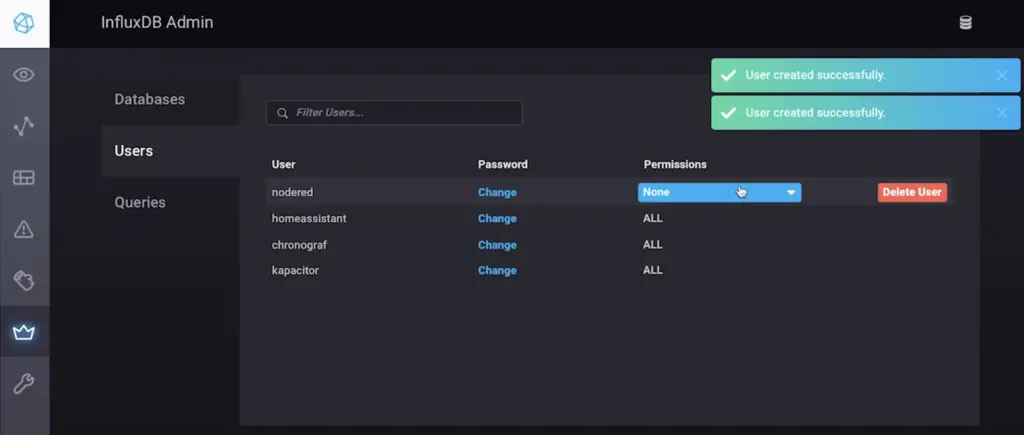
You will also need some users for these databases. Luckily they are created just as easy. Just click on the “Users” tab and create two users and don’t forget to set permissions to “ALL”.
Wow that was really easy. We just created a dedicated Databases and Users for Home Assistant and Node-RED, now let’s integrate the Home Assistant and influxDB.
Home Assistant and InfluxDB integration
You have to edit your configuration.yaml file a bit. You can do that by either use the “File editor” plugin available again in the Home Assistant Add-On store. Or you can use nano or vi text editor from your terminal.
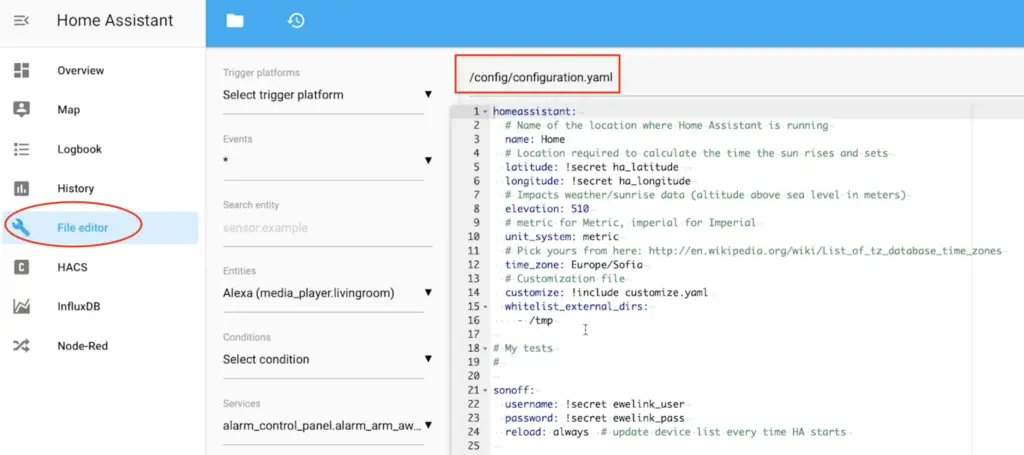
It doesn’t matter how you will edit your configuration, but the important thing is to do it without mistakes. Just add the following lines inside your configuration.yaml file and adapt it if there is such need.
influxdb:
   host: a0d7b954-influxdb
   port: 8086
   database: homeassistant
   username: homeassistant
   password: YOUR_PASS_HERE
   max_retries: 3
   default_measurement: state
You now have to restart your Home Assistant to promote your changes.
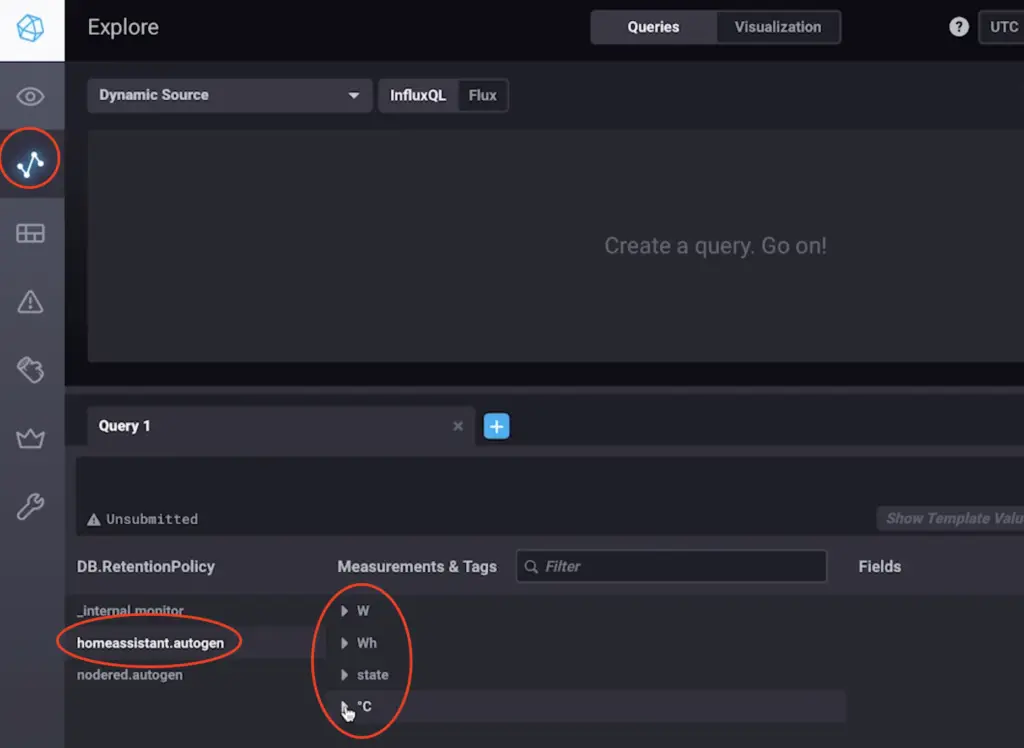
To test if the Home Assistant and InfluxDB integration is successful do the following:
- Open your InfluxDB web interface and click on the “Explore” button.
- Click on your Home Assistant database (in my case homeassistant.autogen)
- Check if there are any Measurements.
It is time for Node-RED and InfluxDB integration – let’s do it:
Node-RED and InfluxDB integration
Still don’t have Node-RED?
Follow this video tutorial and then come back here – LINK
Open your Node-RED installation and go to the “Manage Palette” menu. Click on the “Install” tab and search fo influxDB.
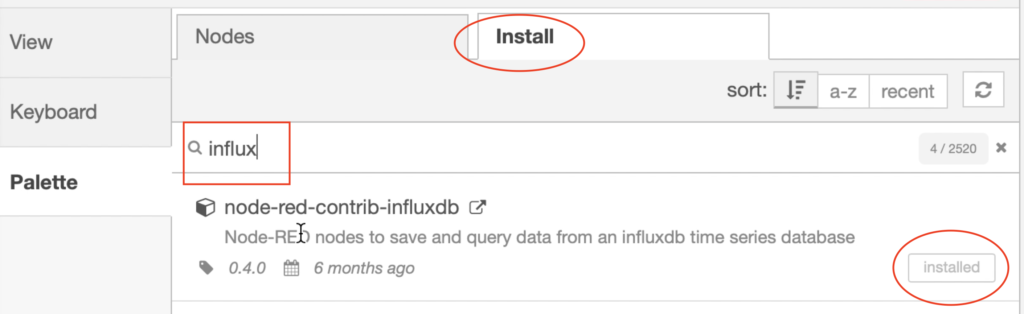
Once you install the node-red-contrib-influxdb. You can try to create a simple flow to test the Node-RED and influx db installation.
You can import the following example and don’t forget to adapt it for your needs – link
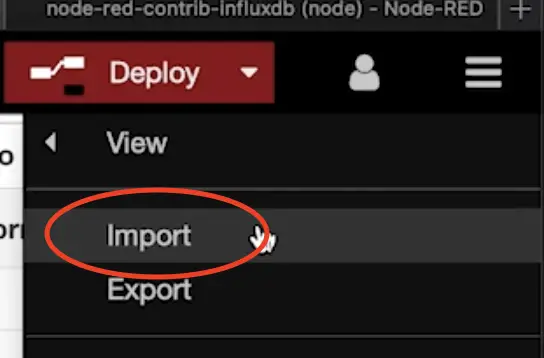
To import the JSON use the import menu within Node-RED.
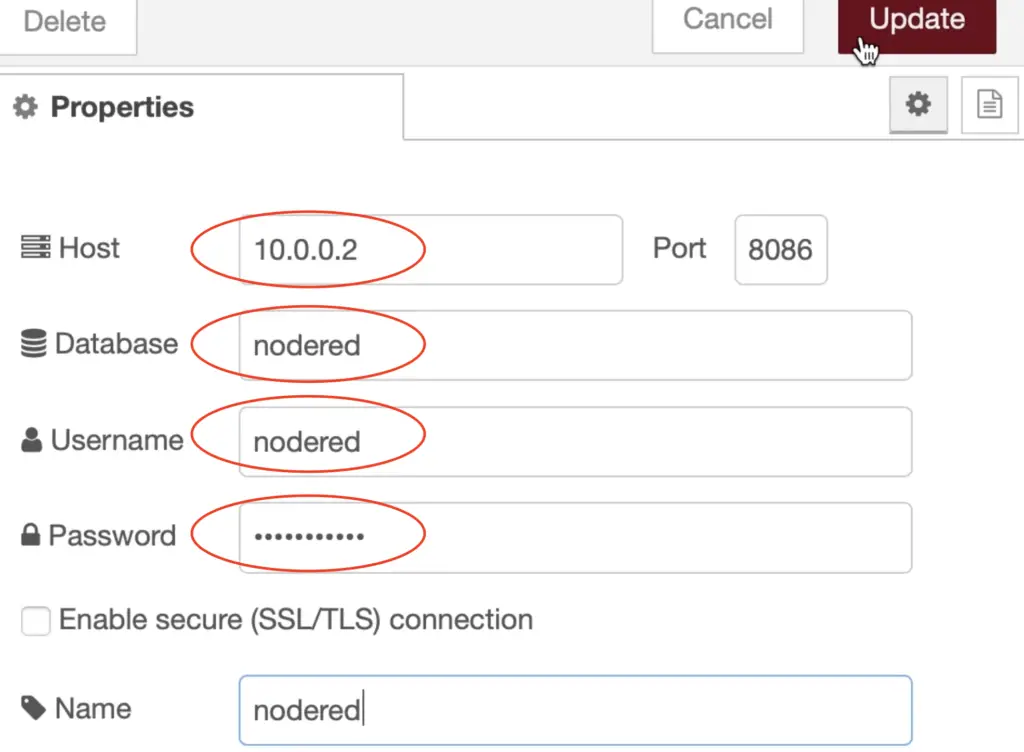
Don’t forget to change your database, username and host in the InfluxDB out node.
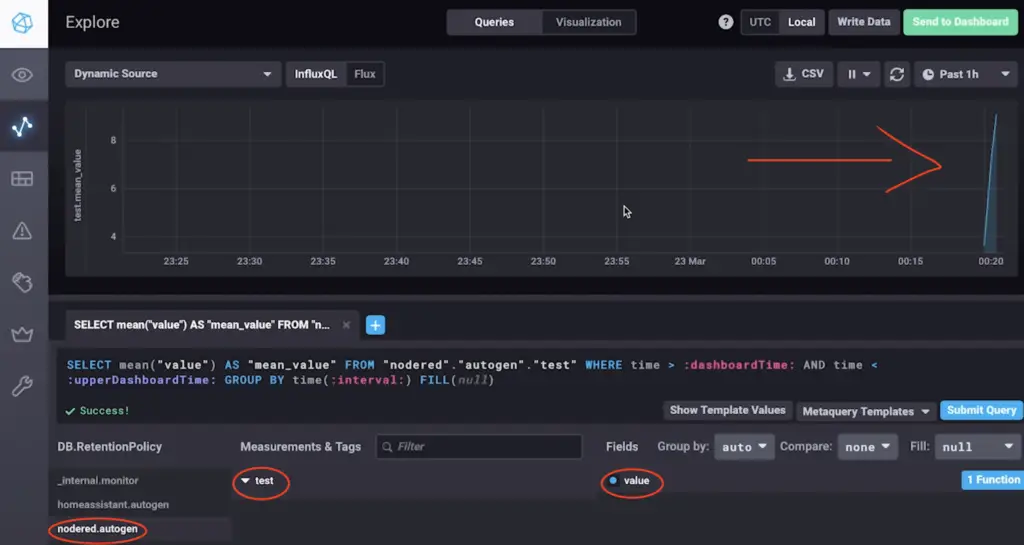
Now you can check if everything is ok with the InfluxDB and Node-RED integration by opening the Chronograf again (The InfluxDB web user interface remember?).
You should have some values pi the measurements like I’m showing in the screen below.
Now It is time for Grafana, let’s first install it.
What is Grafana?
You may wonder what exactly is Grafana? Grafana allows you to visualise the data collected in influxDB (and many other sources) in simple and flexible dashboards and it also have alerting functionalities.
Grafana Installation
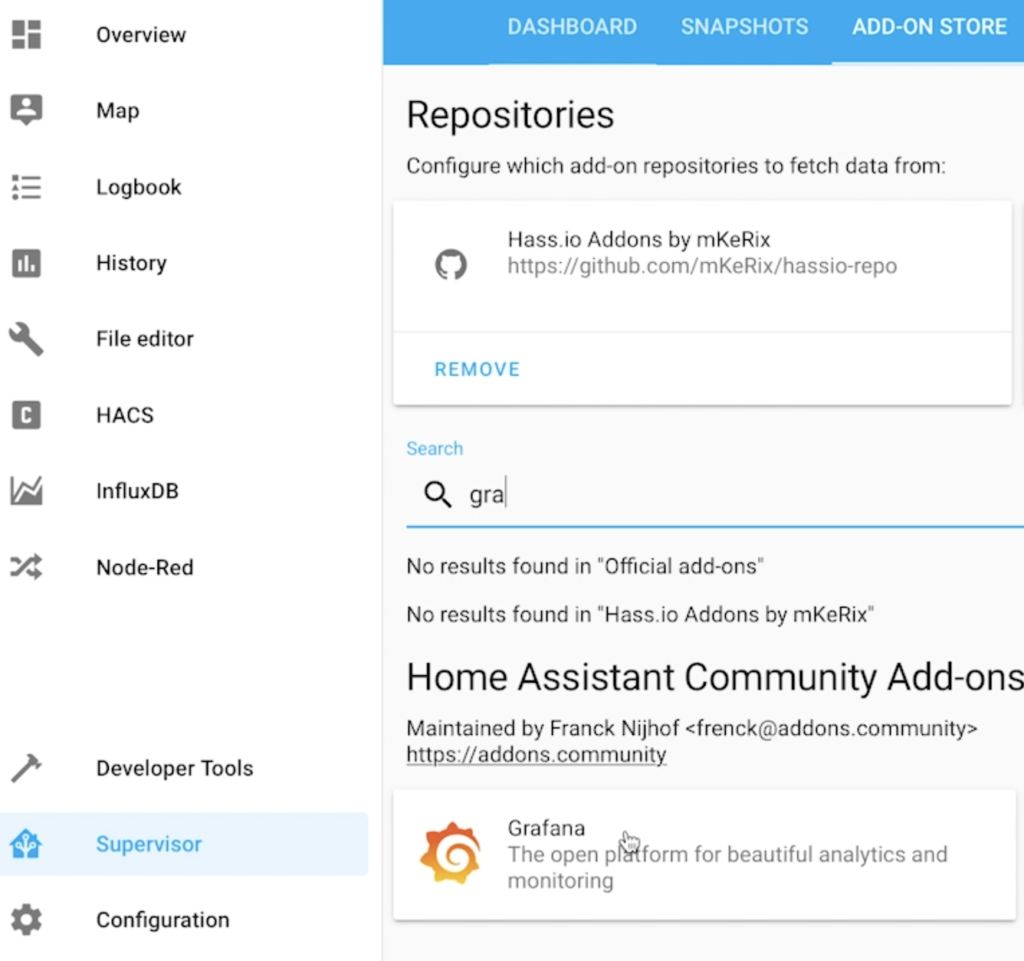
Go to your Home Assistant -> Supervisor -> ADD-ON STORE and search for Grafana.
Click on the “INSTALL” button and after successful installation click on the “START“. After a while you should be able to open the Grafana WEB UI.
This is the official documentation of the Grafana add-on if you need more info – link.
Grafana Is up & running, lets add Home Assistant and Node-RED as InfluxDB Data Sources.
Add Home Assistant and Node-RED InfluxDB data sources in Grafana
Adding data sources is not hard – just click on the “Add data source” icon and then choose InfluxDB.
Then add Name and URL, where the URL should be the hostname where the InfluxDB is installed.
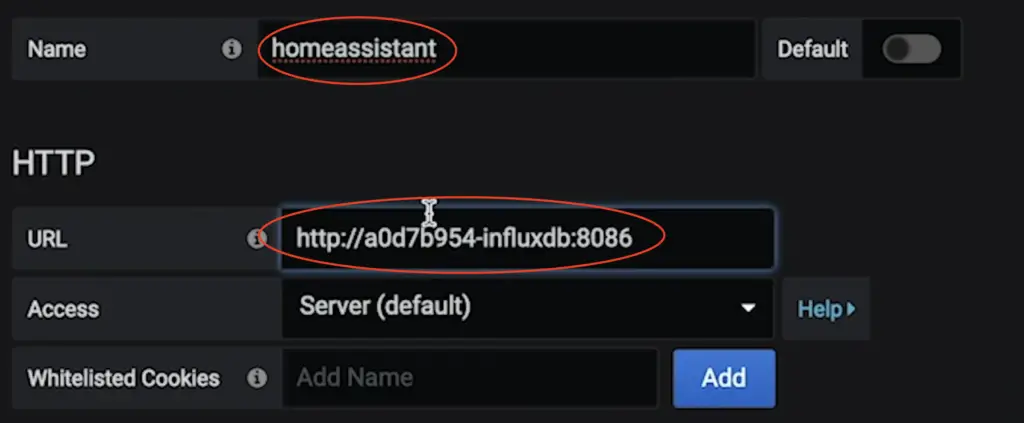
After that enter your InfluxDB, Database, User and Password.
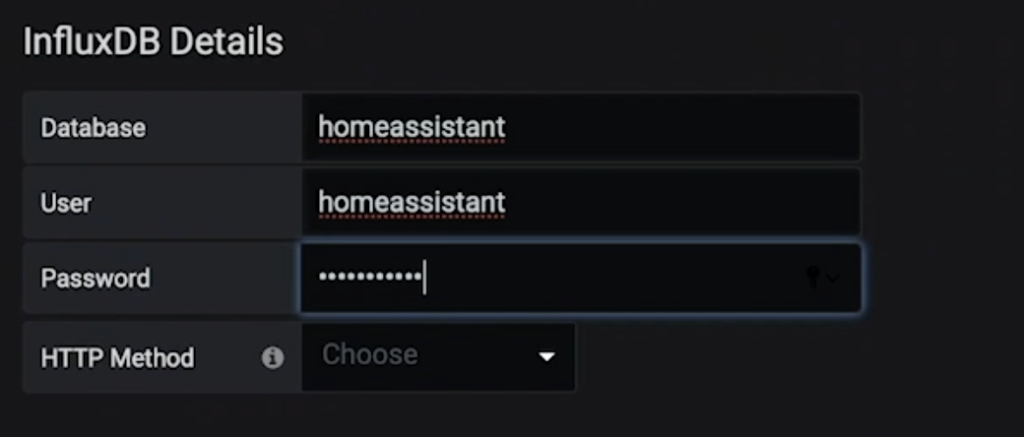
Click “Save & Test”. If everything is 👌 repeat the same process and add data source for the Node-RED database.
Piece of cake, Let’s create some Grafana dashboards now.
Add Grafana Dashboards
The final part of everything described until now is to create a Dashboard that will visualise the collected data and auto update itself.
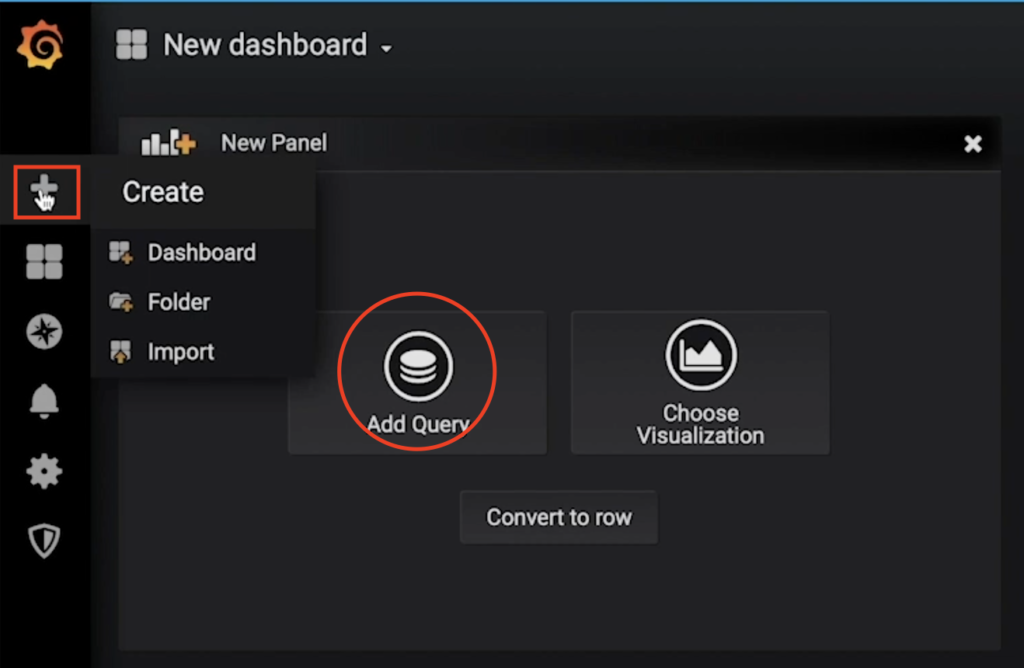
You can create a lot and very complicated Dashboards, but start simple by clicking the big plus button and then choose “Add Query”.
You will be greeted with a screen where you can choose a database and query that database using filters.
Again my recommendation is to start with simple queries like getting single value and visualise it in a Graph.
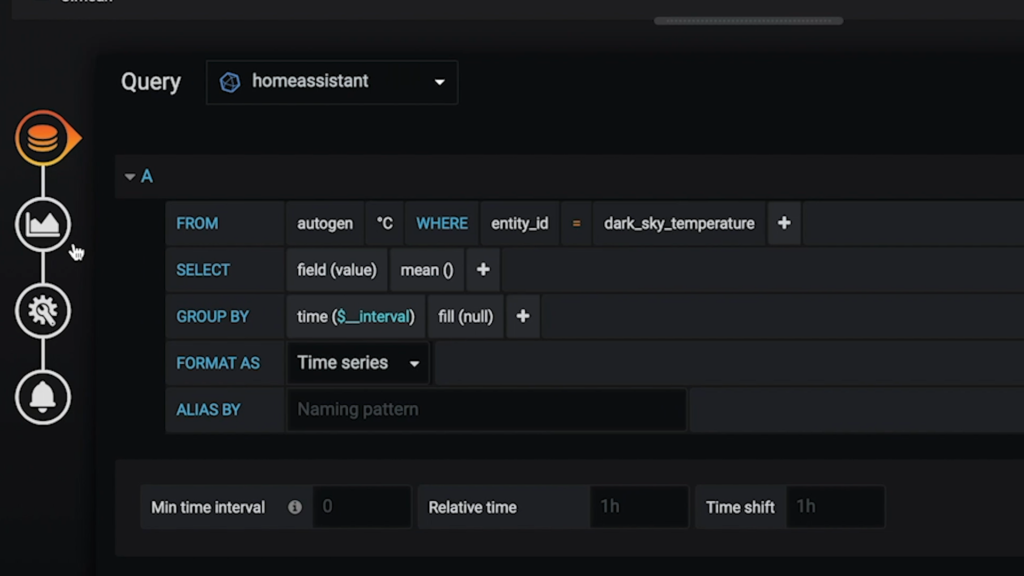
If you are familiar with SQL language this will be relatively easy for you.
After you are ready with the query choose the “Visualisation” icon. Here you can configure how the data will be displayed in the Grafana dashboard
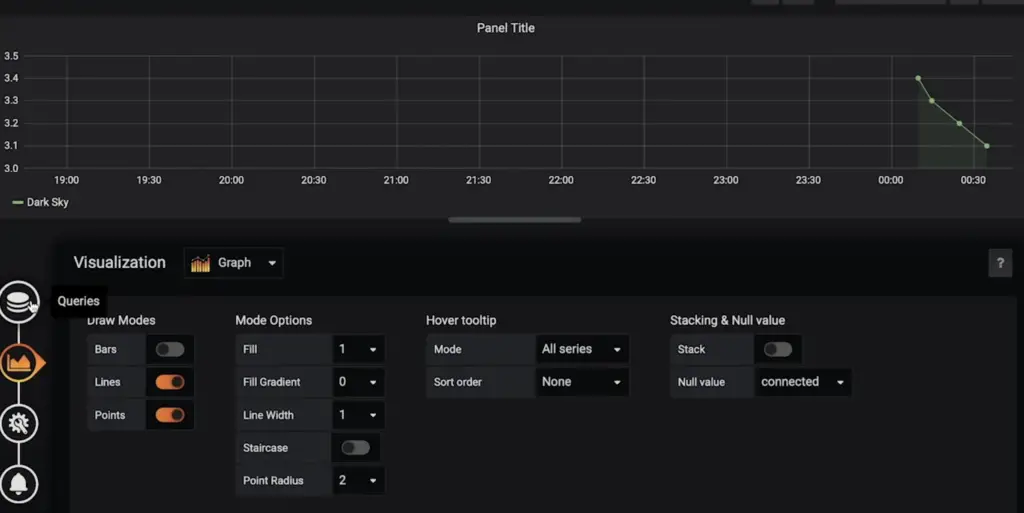
Just hit “save” and enjoy it.
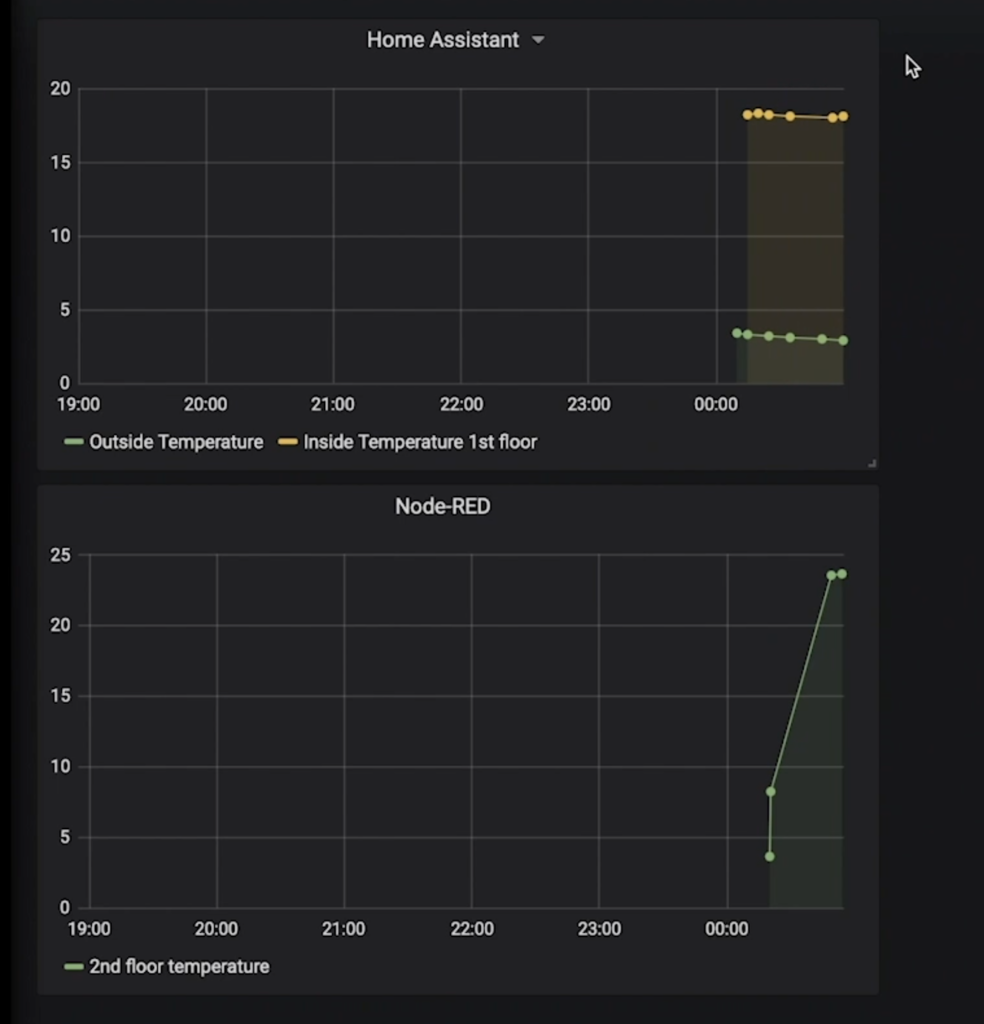
You can add more panels in one dashboard. This is my final Home Assistant Node Red InfluxDB and Grafana integration result. Which is showing the internal and external temperature in two separate panels: one from Home Assistant and one from Node-RED.
Question for You
Are you going to try this InfluxDB & Grafana monitoring setup? You can say simple “yes” or “no” in the comments and I will know for what are you talking about.
Support my work
Any sort of engagement on this channel does really help out a lot with the Google and YouTube algorithms, so make sure you hit the subscribe, Like and Bell buttons If you enjoy this article.
Also feel free to add me on Twitter by searching for @KPeyanski.
I really hope that you find this information useful and you now know how to integrate InfluxDB and Grafana with Home Assistant and Node-RED.
Thank you for watching/reading, stay safe and see you next time.
sei troppo bravo ,cerco di seguire le tue guide ,ma non riesco a far funzionare nulla ,troppo difficile.
How to install influxdb user interface on rpi?
You have to install Chronograf – https://www.influxdata.com/time-series-platform/chronograf/
How to create user and pass in InfluxDB ?
Under the Heading – Create Home Assistant and Node-RED databases in the article I’m explaining how. You can also see that in the video. If you still have issues – write again.
After running influx to access influxdb: create user with password ”
Thank you, Could you review in order to use INFLUXDB Cloud?