
In today’s article I will show you how to add a Home Assistant System Monitor to track the CPU temperature, free disk space and general performance of your system where Home Assistant is installed. Also how to check the Home Assistant Database size, how to measure the network bandwidth and how to make useful automations that will notify you if something goes above certain threshold.
Table of Contents
Monitor Home Assistant Performance
We are using Home Assistant to monitor different sensors and to control many devices, we are constantly adding more and more Home Assistant add-ons, cards and custom components. All of this is fine, but for sure it can affect the performance and the free disk space of your system where Home Assistant lives. That is why a proper monitoring is a must and this is exactly what we are going to talk about.
Starting right now!
Home Assistant System Monitor
We will add the Home Assistant System Monitor platform to add several useful sensors, which will untie our hands for automations and scripts that will help us to see what is really happen with the performance. Here is what you need to do:
Add the following YAML code in you configuration.yaml file
sensor:
- platform: systemmonitor
resources:
- type: processor_use
- type: disk_use_percent
arg: "/"
- type: disk_free
arg: "/"
- type: memory_use_percent
- type: network_in
arg: eth0
- type: throughput_network_in
arg: eth0
- type: network_out
arg: eth0
- type: throughput_network_out
arg: eth0
- type: processor_temperature
- type: last_boot
# OPTIONAL CPU Raspberry Pi Temp
- platform: command_line
name: CPU Temp
command: "cat /sys/class/thermal/thermal_zone0/temp"
unit_of_measurement: "°C"
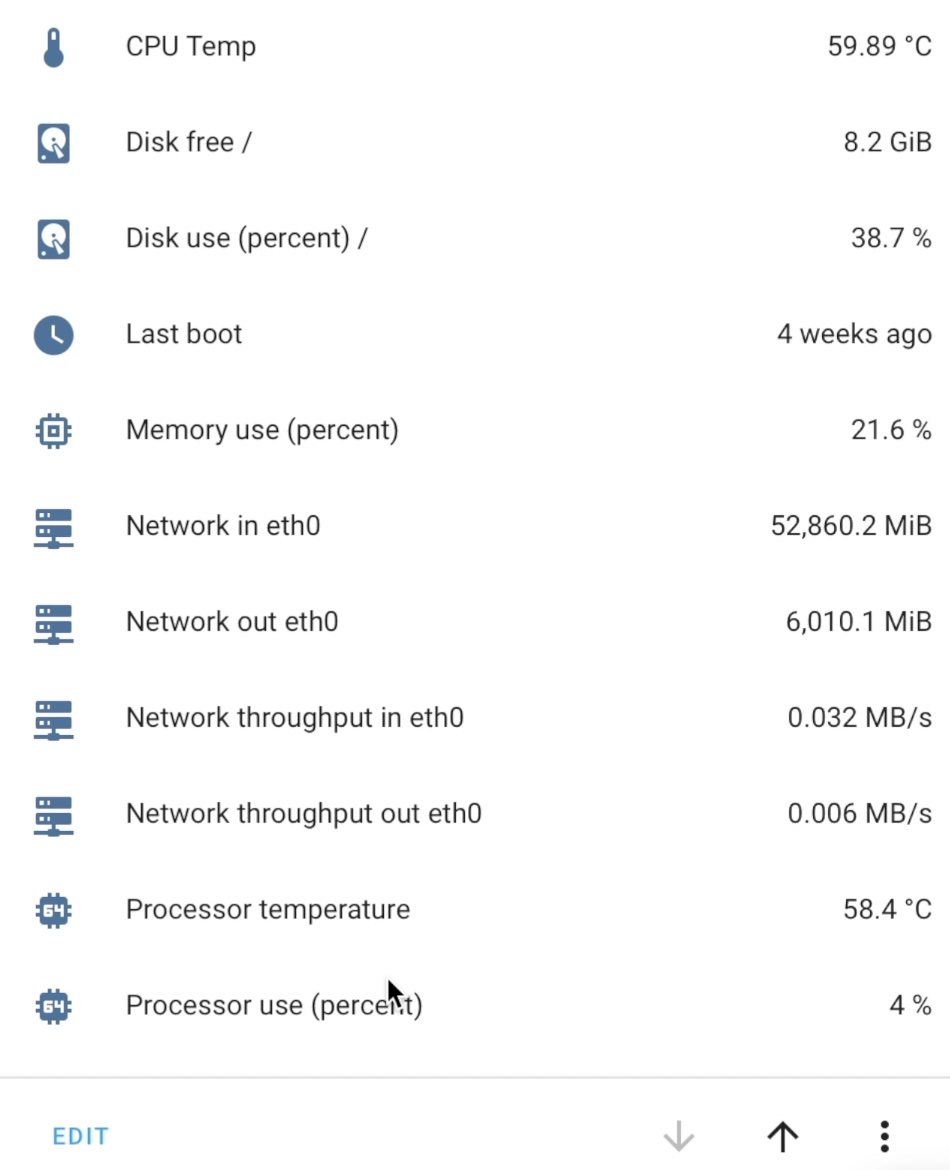
value_template: '{{ value | multiply(0.001) | round(2) }}'The section above will add 11 sensors (for every -type:) that will show the used and free disk space, network & processor usage. Save the changes and restart your Home Assistant.
TIP: There is additional and optional section (below # OPTIONAL CPU Raspberry Pi Temp comment) that will add CPU temperature sensor using different approach. You can use it (if you are using Raspberry PI) or remove this completely – depending of your needs.
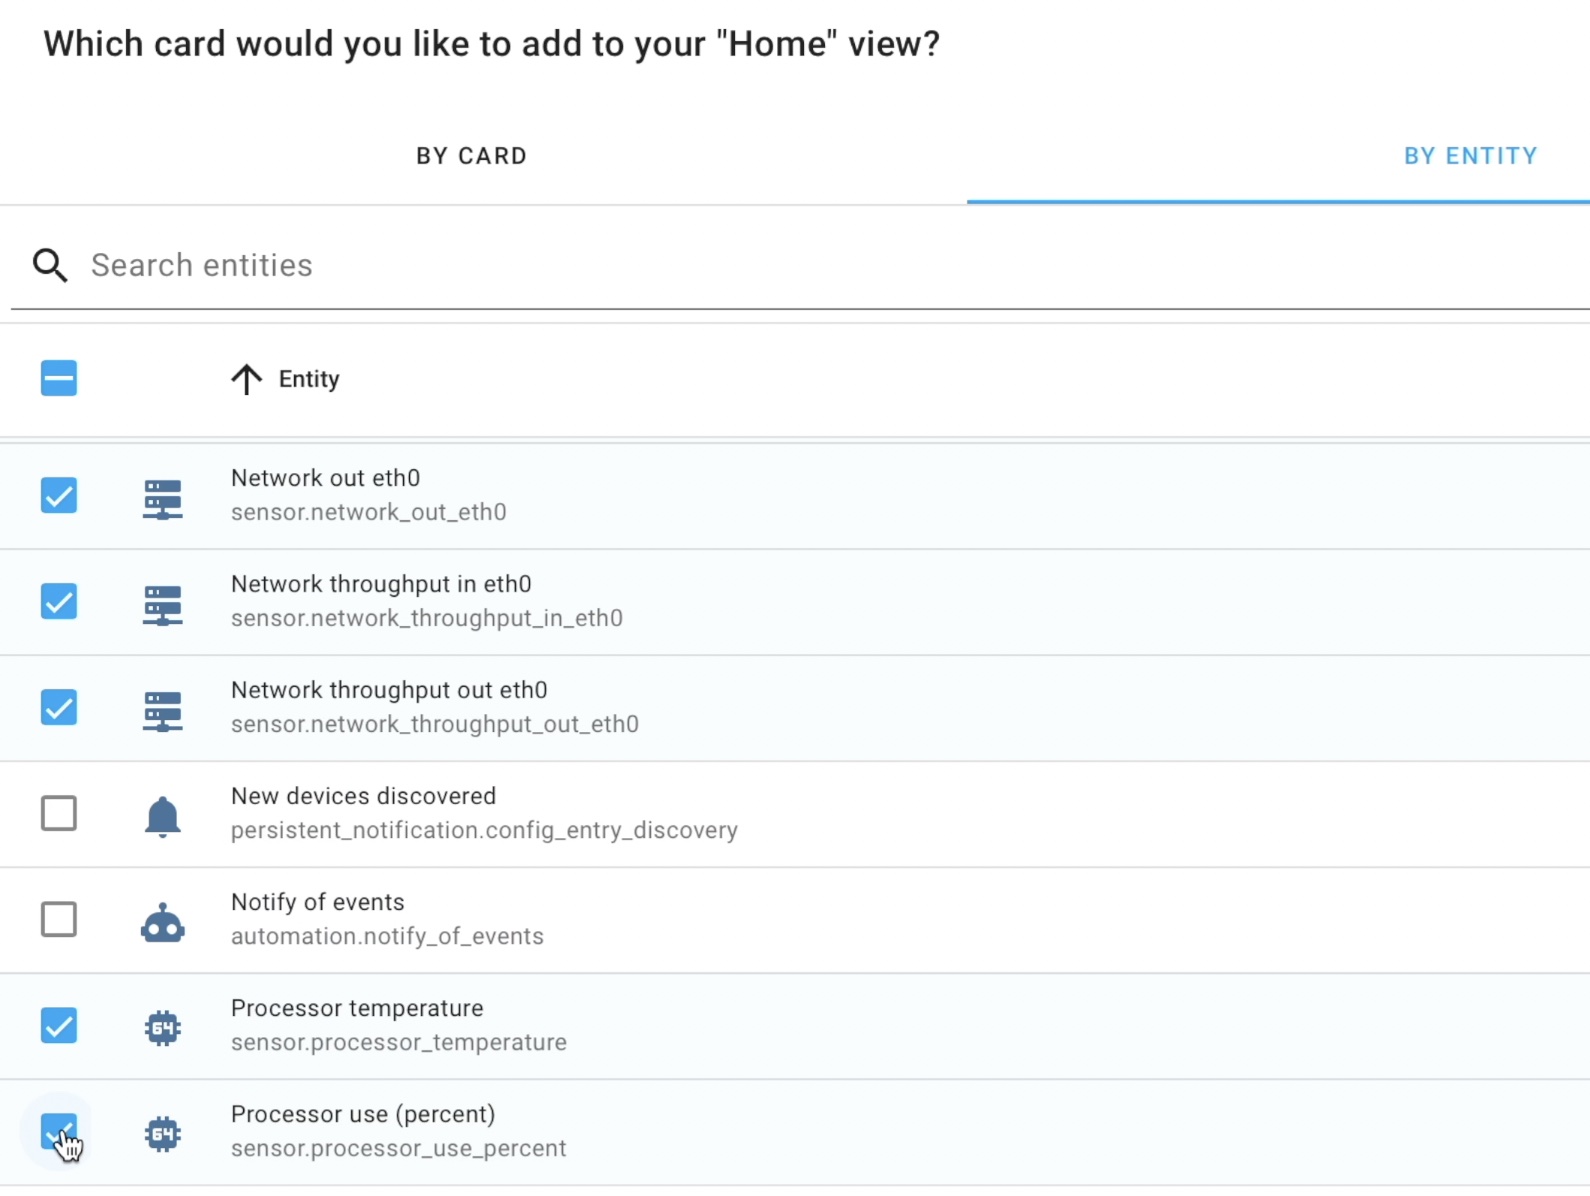
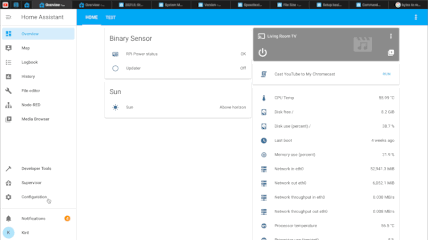
After Home Assistant boots again – you can add an Entities card and select your new Sensors.
As end result you will have a card showing (almost) every important metric about your Home Assistant system in Home Assistant.
How to make Automation for CPU temp using System Monitor sensors?
Let’s create a Home Assistant automation that will monitor the CPU temperature and that will send notifications if the CPU temperature goes above specific value (58*C in the case below).
Oh, wait a second I forgot to smash the subscribe button for my Newsletter Now let’s continue.
You can use the Home Assistant GUI to make the automation as can be seen in my video. Or you can paste the following YAML in the automations.yaml file, located in your Home Assistant config folder.
# automations.yaml entry
alias: Notify when CPU is hot
description: ''
trigger:
  - platform: numeric_state
    entity_id: sensor.processor_temperature
    above: '58’                  # change this to whatever suits you
condition: []
action:
  - service: persistent_notification.create
    data:
      message: CPU is above 58C  # change this to whatever suits you
mode: single
In the above automation you may wish to change the entity_id: if yours is different, as well as the message: and the above: values.
Save the automations.yaml file, reload automations from Configuration > Server Controls.
From now every time the CPU temperature of your system where Home Assistant is installed goes above 58*C – you will receive a persistent notification saying exactly that.
How to monitor Home Assistant Database size?
By default the Home Assistant Database is located in a file called home-assistant_v2.db located in Home Assistant config folder. Here is how you can make a sensor to monitor the database size!
Add the following YAML in your configuration.yaml file using text editor or add-on (like File editor)
# configuration.yaml entry

homeassistant:
  allowlist_external_dirs:
    - "/config"

sensor:
  - platform: filesize
    file_paths:
      - /config/home-assistant_v2.db
TIP: If you already have homeassistant: or sensor: section in your configuration.yaml file – you should omit these two keywords and paste only the other parts preserving the YAML indentation.
- The first section (that start with homeassistant:) allows accessing the config folder where home-assistant_v2.db is located.
- The second section (that start with sensor:) is adding a sensor of platform filesize, which is exactly what we need here.
Save the changes and restart your Home Assistant. After the restart you can add the new sensor to your Home Assistant Lovelace exactly as the previous sensors and even in the same Entities card.

How to make automation for Home Assistant database size monitoring?
This time we will make the following automation: If your Database size goes above certain size, then send a persistent notification.
Open your automation.yaml file and paste the following code:
# automations.yaml entry

alias: Notify if HA DB gets bigger
description: ''
trigger:
  - platform: numeric_state
    entity_id: sensor.home_assistant_v2_db
    attribute: bytes
    above: '232472000'              # change this to whatever suits you
condition: []
action:
  - service: persistent_notification.create
    data:
      message: HA DB is above 232MB # change this to whatever suits you
mode: single
You may wish to change the above: section with the size (in bytes) that you wish, and probably the message:
After that save the changes and reload the automations from Configuration > Server Controls in Home Assistant.
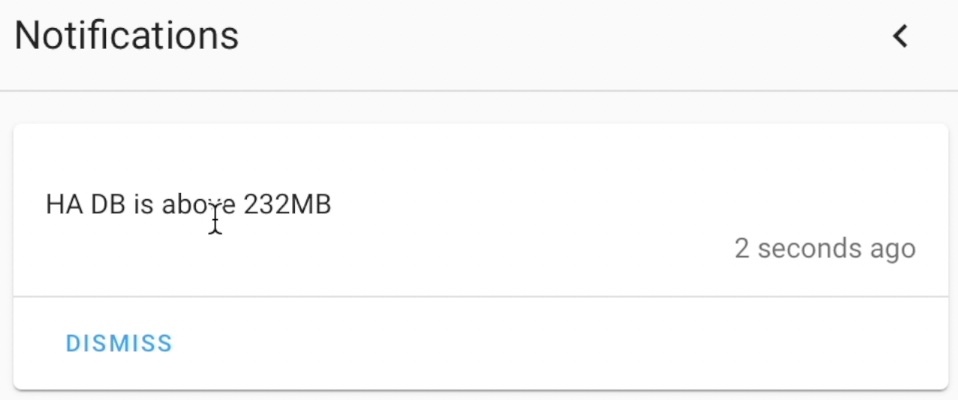
From now on if Home Assistant Database goes above 232MB (around 232472000 bytes) you will receive the message: “HA DB is above 232MB” (or whatever you wrote there).
How to check the Home Assistant Integration startup time?
Starting from Home Assistant release 2021.5.0 you can check how much time every integration is taking during the Home Assistant startup. Here is where you can check this:
Go to Settings > System > Repairs > Three dots menu (upper right corner) > Integration Startup Time. Scroll down and you will see the Integrations and their Setup/Startup time.
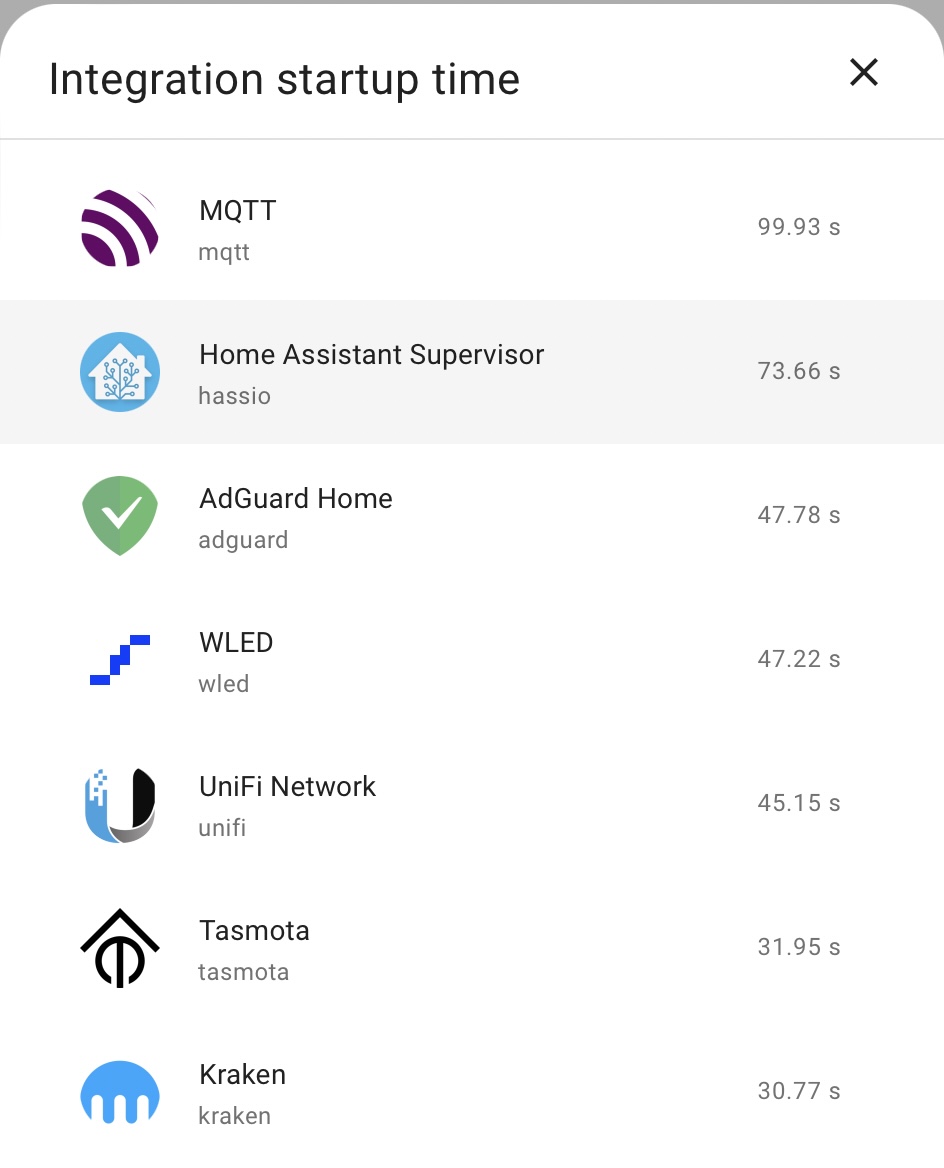
From Info tab you can check every integration startup time like the Frigate for example. If you don’t know what Frigate is check this article of mine – LINK
Home Assistant Speedtest.net integration how to?
We can use the speedtest.net integration for Home Assistant to measure the network bandwidth performance. Here is how:
In Home Assistant, go to Configuration > Integrations > Add Integration and search for speedtest.net. Click on the result and install the integration.
After you are ready you will have 3 new entities/sensors for ping latency, download & upload speed. You can use these sensors for different automations and scripts. For example you can periodically check if your network performance is optimal and to automatically send messages and screenshots to your ISP if they are not
Summary
With that being said your Home Assistant System Monitor is done! Stay Safe and don’t forget – Home Smart, but not hard!
Thank you for reading and I will see you in my next article.
Thank you for that nice tutorial. I’m wondering, if you can populate the https://github.com/ironsheep/lovelace-rpi-monitor-card with these systemmonitor entities that are pure locally and don’t come via MQTT?
This does not work anymore with the later versions of HA:
“Go to Configuration > Info, scroll down and you will see the Integrations and their Setup/Startup time.”
I looked around and searched online but can’t find an answer. Do you perhaps know?
Hi there Cobus,
the new menu location is now Settings -> System -> Repairs -> Three dots menu (upper right corner) -> Integration Startup Time.
I will update the article as well.
This code now produces a warning in Home Assistant:
Command Line YAML configuration has moved
This stops working in version 2023.12.0. Please address before upgrading.
Configuring Command Line sensor using YAML has moved.
Consult the documentation to move your YAML configuration to integration key and restart Home Assistant to fix this issue.